
Dashboards Are Not Visibility
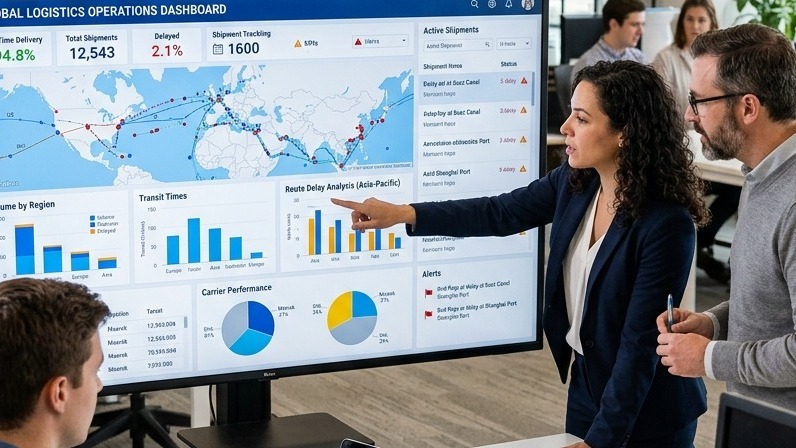
Most supply chain operations teams have dashboards. They show inventory levels, shipment statuses, warehouse throughput, and order fulfillment rates. Sophisticated ones add alerts when metrics breach thresholds. This infrastructure is useful, but it describes what has already happened. It is a rearview mirror with data labels.
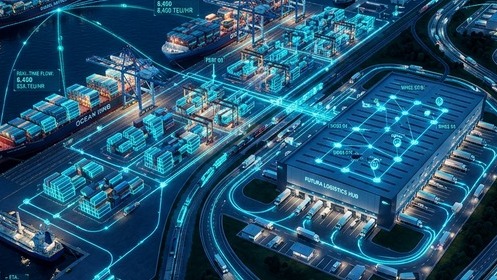
A digital twin is something fundamentally different: a live, computational model of the physical supply chain that reflects current state and can be interrogated about future states. The distinction matters more than it might seem. A dashboard tells you that your Singapore distribution center has 12 days of inventory for product SKU-4471. A digital twin lets you ask: "If the container ship from Guangzhou delays by 8 days and demand increases 15% because of the upcoming promotion, when do we hit a stockout, and which alternative routing options prevent it and at what cost?"
That is the shift from reactive to predictive operations. And it is not a theoretical aspiration - organizations that have built genuine digital twin capabilities for their supply chains report 15-25% reductions in inventory carrying costs, 30-40% improvements in on-time delivery performance, and dramatically faster response times when disruptions occur. The technology to do this now exists at enterprise scale, and the IoT and ERP integration patterns are mature enough to be repeatable.

The IoT Sensor Architecture That Makes It Real
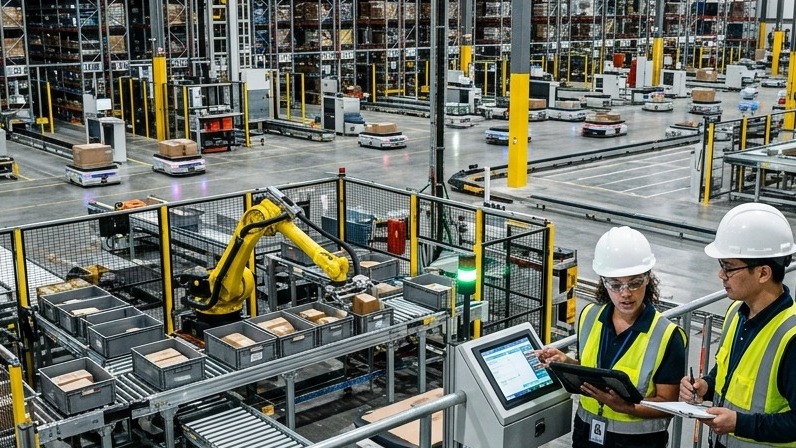
A digital twin is only as accurate as its data feeds. For supply chain applications, the primary data sources are IoT sensors deployed across the physical logistics network: warehouse floor sensors tracking inventory location and movement, temperature and humidity sensors for cold chain logistics, GPS trackers on vehicles and containers, weight sensors on loading docks, and RFID readers at facility entry and exit points.
The engineering challenge is not the sensors themselves - commodity IoT hardware is relatively inexpensive and reliable. The challenge is the data pipeline from sensor to model. A mid-size supply chain operation might generate 500,000 to 2 million sensor events per day. That data needs to be ingested in near-real-time, normalized from the diverse formats that different sensor manufacturers use, validated for quality (sensors fail, connections drop, data anomalies occur), and fed into the model fast enough that the model's state meaningfully reflects physical reality.
The architecture that handles this at scale typically involves:
- Edge processing. Filtering and aggregating raw sensor data at the facility level before it reaches central systems reduces data volume by 70-80% and ensures that network connectivity issues at a single facility do not propagate into the central model as data gaps.
- Event streaming infrastructure. Apache Kafka or AWS Kinesis to handle the volume and velocity of normalized sensor events with the durability guarantees that operational systems require.
- State management layer. A time-series database (InfluxDB, TimescaleDB, or AWS Timestream) maintains the current and historical state of every entity in the supply chain - inventory units, vehicles, facilities, shipments - that the digital twin model queries.
- ERP integration bridge. Bidirectional integration with the ERP system (SAP, Oracle, or equivalent) that keeps transactional records - purchase orders, inventory bookings, logistics contracts - synchronized with the operational state the IoT sensors report.
ERP Integration: The Hardest Part
The IoT architecture, while complex, is largely greenfield - you are building new systems on modern infrastructure. The ERP integration is where most digital twin projects encounter their most serious friction, because ERP systems were designed for transactional accuracy, not real-time operational visibility.
SAP ECC, for example, processes transactions in batch updates and maintains records at a level of abstraction that does not map directly to physical events. An inventory adjustment in SAP represents a bookkeeping entry, not necessarily a real-time physical movement. The gap between what the ERP says and what the IoT sensors report is not a bug - it is the inherent difference between a transactional system and an operational one.
Bridging this gap requires a reconciliation layer that understands both models: the transactional truth of the ERP and the operational truth of the sensor network. In practice, this means:
- Defining explicit reconciliation rules for common discrepancy patterns (goods received in the warehouse before the ERP purchase order is confirmed, for example)
- Building confidence scoring into the model's state representation - distinguishing between inventory positions that are confirmed by both ERP records and sensor data versus positions confirmed by one source only
- Creating feedback loops so that sensor-detected discrepancies trigger ERP exception workflows rather than being silently ignored or overriding ERP records without human review
Simulation and Predictive Disruption Modeling
Once the live model is stable and trusted, the high-value capability becomes simulation: running what-if scenarios against the current state to evaluate options before committing to them.
Consider a realistic scenario: a major supplier announces a 10-day production halt due to a factory fire. A supply chain team without simulation capability must manually assess which products are affected, estimate depletion rates from current stock, identify alternative sourcing options, and model the cost of each response. This process typically takes days, by which time the window for optimal response has often closed.
With a digital twin simulation layer, the same scenario can be modeled in hours. The system identifies all affected SKUs automatically (because it knows the supplier-to-product relationships from the ERP integration), applies current consumption rates from sensor data to project stockout timelines per facility, generates alternative routing options based on contracted logistics capacity, and presents a cost-ranked decision set for procurement leadership to evaluate.
More advanced implementations incorporate probabilistic disruption modeling: using historical disruption patterns, supplier risk scores, geopolitical indicators, and weather data to generate proactive risk assessments. The model flags developing risk concentrations before they become emergencies - a 60% probability of port congestion in a key routing hub, for example, surfaced three weeks in advance rather than discovered when containers start piling up.
A Southeast Asian electronics manufacturer that implemented this capability reported a reduction in average disruption response time from 4.2 days to 11 hours, and a 28% decrease in emergency freight costs (the expensive air freight that becomes necessary when ground disruptions are discovered too late).

Building the Business Case
Digital twin projects are capital-intensive. A comprehensive implementation covering IoT infrastructure, ERP integration, the modeling layer, and simulation capabilities typically represents an 18-24 month program and a significant technology investment. The business case needs to be robust.
The ROI drivers are well-established across implementations:
- Inventory optimization. Better visibility enables tighter safety stock calibration. A typical improvement of 15-20% inventory reduction while maintaining or improving service levels represents significant working capital release for businesses with large SKU counts and high inventory value.
- Logistics cost reduction. Predictive routing and proactive disruption response reduce emergency freight costs, which typically run 3-5x the cost of planned logistics. Organizations that reduce emergency freight from 8% to 3% of total logistics spend generate meaningful savings at scale.
- Waste reduction in perishable supply chains. For food, pharmaceutical, and cosmetics supply chains, improved cold chain visibility and predictive shelf-life modeling consistently deliver 10-15% reductions in product waste - a cost category that compounds inventory and logistics savings.
- Customer experience improvements. Accurate delivery prediction (enabled by real operational data rather than static lead time estimates) reduces customer service inquiry volume by 20-30% in implementations we have seen, with corresponding service cost savings and improved NPS.
GTEMAS Approach to Digital Twin Implementation
GTEMAS builds supply chain digital twins through a phased approach that delivers operational value at each stage rather than requiring the complete program to be built before value is realized. Phase one focuses on IoT sensor deployment and the data pipeline to a central state management layer - this alone delivers improved operational visibility within 90 days. Phase two integrates the ERP bridge and establishes the reconciliation layer. Phase three introduces simulation capabilities once the live model has established trust over several months of operation.
The phased model serves a practical purpose beyond financial risk management: it gives operations teams time to develop the organizational capabilities to use predictive insights. The technology is only part of the value. Organizations also need decision protocols for acting on simulation outputs, governance processes for model maintenance, and operational training for the teams who will work with the system daily.

Supply chain visibility in 2025 is not about better dashboards. It is about building a computational model that lets your operations team make better decisions faster than your competitors can. If your organization is evaluating digital twin capabilities for your supply chain, we would welcome a conversation about what a phased implementation might look like for your specific environment.